Debug Panel v1.3 for .NET
Debug
Panel is a VB User Control useful for enhancing the ASP.NET
trace panel by adding a few missing items such as: A navigation index
(which shows only the section you want and hides all other sections); A
JavaScript debugger and basic DOM walker; ability to show the debug
panel when Trace is disabled in .NET (user specific); and a lot of
other useful information. By placing 2 lines of code in your
footer/master page this control will be added to the top of the .NET
trace panel.
Note:
This code runs under .NET 2.0 only. For .Net 1.1 there is a zip file called Debug12.NET11.zip which contains ver1.2 and is no longer being updated.
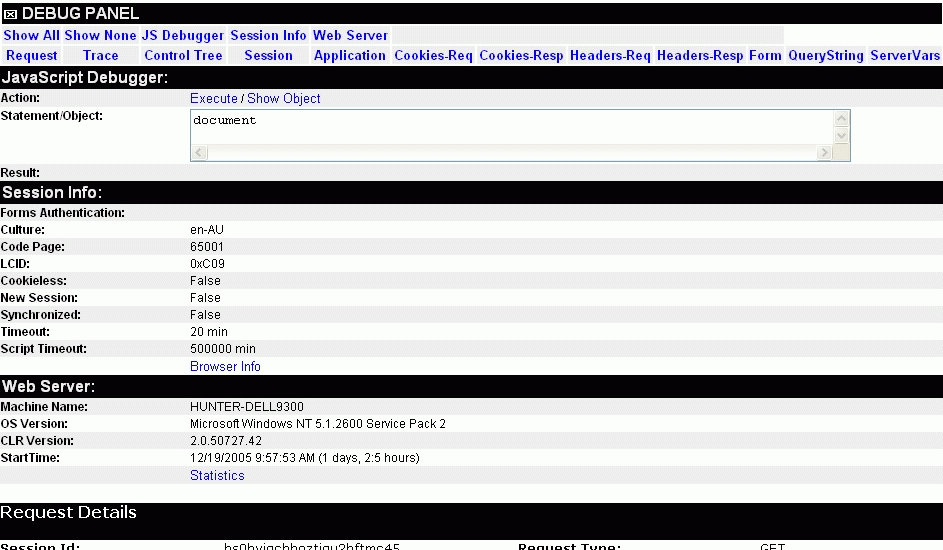
Partial
Screenshot:

The Debug Panel layout is:
A boxed X next to the "DEBUG PANEL" text which will
hide all of the trace panels. Refresh browser to unhide again.
The index below that is dynamic, depending on the .NET Trace mode and
collections which contain items. By selecting a panel from the index,
it hides all other panels to show only what you are interested it.
(Ever tried to find the Session panel when you have a massively long
control tree which displays above it?)
With ASP.NET Trace enabled:
First
Row:
Show
All - Makes all sub-panels visible (default)
Show
None - Makes all sub-panels invisible, but still shows the
Index
JS Debugger - Javascript debugger
and basic DOM browser
Session Info -
Missing session properties from .NET's panel
Web
Server - Info about your web server
Second
Row:
Standard ASP.NET panels:
Request,
Trace, Control Tree, Session, Application, Cookies-Req, Cookies-Resp,
Headers-Req, Headers-Resp, Form, Query String, Server Variables
With ASP.NET Trace disabled, and the panel enabled via your condition*:
First Row:
Show All - Makes all sub-panels visible (default)
Show
None - Makes all sub-panels invisible, but still shows the
Index
JS Debugger - Javascript debugger
and basic DOM browser
Second
Row:
General - similar to
.NET's Request panel
Query String -
Collection contents
Form - Collection
contents
Trace - DebugTrace session
collection contents**
Session -
Collection contents and Session Info properties
Application
- Collection contents
Cookies-Req -
Request Collection contents
Cookies-Resp
- Response Collection contents
Server Variables
- Collection contents minus the ALL_HTTP and ALL_RAW items which are a
basic duplicate of the other collection items
Web
Server - Info about your web server
If
you wish to see ASP.NET's standard trace panel (and have this debug
panel attach to it) you need to have tracing enabled and page outputs
enabled too in your web.config:
<trace enabled="true" pageOutput="true"
...
*Enabling - or viewing the panels - when ASP.NET's Trace is disabled
ASP.NET's Trace has 3 modes: enabled, disabled and enabled on localhost only (and pageOutput enabled/disabled). What if you are a developer and are checking a report of a bug from a remote location? You will never see the trace/debug panel. Checking your application from the localhost may not be viable as the server is locked away and VNC type access involves a lot pf paperwork for it to be enabled for a short period. That is why having another factor to enable the debug panel is required. The only down side is that the Trace part of the .NET's trace panel is not available when Trace is disabled with my debug panel.
My solution is check for a developer flag in the user role. You may need to alter the code to your situation. In debug.asx.vb, line 33, you may need to change the line from:
If Trace.IsEnabled Or User.IsInRole("Dev") Then
to whatever identifies you as a user capable of seeing the panel. In my case, my User Role has Dev (for developer) in it. Maybe you would have a Boolean session variable called Debug which you check like this:
If Trace.IsEnabled Or Session("Debug") Then
**Custom Trace (DebugTrace) - when ASP.NET's Trace is disabled
When ASP.NET's Trace is disabled, Trace.Write's are not logged. In order to write to the Trace section of this panel, you need to implement some code elsewhere in your application. I use a custom logging component. This component writes to the ASP.NET trace and this custom trace among other things (such as a file). You can add it to your own logging class or else where (ie. main application assembly or even in your page code). I have added the code to the demo.aspx.vb file to demonstrate it and allow you to copy it into something else.
The core of the code to write to the custom trace is shown below. It extends and adds to a 2D array which is stored in the session. When the Debug Panel reads the array at the end of the page build, the array is then destroyed so it doesn't consume resources.
Dim aryTrace(,) As
String =
Session("DebugTrace")
ReDim Preserve
aryTrace(1, UBound(aryTrace, 2) + 1)
aryTrace(0,
UBound(aryTrace, 2)) = Category
aryTrace(1,
UBound(aryTrace, 2)) = Message
aryTrace(2,
UBound(aryTrace, 2)) = Now
Session("DebugTrace") = aryTrace
JavaScript Debugger / DOM Browser
Javascript debugger and DOM browser panel can be highly useful. You can execute Javascript from the Statement box, such as alert(strVariable); or anything else you need to do in order to debug your page's script. Press Execute to execute your statement.
To browse the DOM, type in the object you wish to start from and press Show Object. For example, start with the object: document then walk down the tree by clicking on any item which is hyperlinked. This part of the script is a touch slow due to the sorting of the items into alphabetical order.
A public function is also available to the page's Javascript: cbgLog can be used to write entries to the Results area of this panel. This acts similar to the server side Trace.Write function. Instead of inserting lots of alerts something like: alert("value is now:"+intX); in your JS code to debug it, you would write the previous example like: dbgLog("value is now:"+intX); and see all of the text added nicely into the JavaScript Debugger, Results section.
Session Info
This section either appears as
a separate panel in Trace mode, or on the bottom part of the Session
collection panel with Trace disabled. It is made of of mainly session
properties:
Thread's Current Culture Name (not really
anything to do with the session), Code Page, LCID, Cookieless, New
Session, Synchronized, Session Timeout, and Script Timeout.
A Browser Info link is also listed (General section if ASP.NET trace is disabled) which loads a new page and provides various browser information. It uses client side script to display such things as: browser version; languages; standards mode; JS version; screen sizes and colours; java and cookies enabled; history.
Web Server Info
This section contains some handy info about your web server. This includes: Machine Name, OS Version, CLR (.NET) version and server start time. A Statistics link is also listed which loads a new page. This page contains ASP service statistics such as: Process ID, Start Time, Running Time, Peak Memory Used, Status, Memory Free, and current Disk Queue and CPU load. A history of service start/stops for this server boot is also listed.
Again,
you may need to alter the code to set the directory of your
debug-info.aspx file. The default is "". This is found in debug.asx.vb,
line 16:
Private DebugDir As
String = "/Controls/"
Usage
Register the control file at the very top of your aspx (or ascx) page like this...
<%@ Register TagPrefix="HB" TagName="Debug" Src="Debug.ascx"%>
Insert the control at the very bottom of your footer (just before your </body> tag):
<HB:Debug id="ctlDebug" runat="server" />
See Demo.aspx for a full demonstration!
Licence
Permission to
use, copy, modify, and distribute this software and its documentation
for any purpose and without fee is hereby granted, with only one
condition: References to the original author in the comments of the
source code/scripts must remain in place. No other conditions or
restrictions are made.
This software is provided "as is" without express or implied warranty.
If you improve this code, please send me a copy! Thanks!
Donate
via PayPal
Hunter
Beanland
hunter
@ beanland.net.au
http://www.beanland.net.au/programming/dotnet/
Version History